OpeningParliament.org

Posts tagged "Czech Republic"

Global Legislative Openness Week showcases broad, global movement

Posted October 3, 2016 at 8:00am by gregbrownm

As in previous years, Global Legislative Openness Week (GLOW) showcased the fantastic work being done around the world to realize the principles of open parliament. Organized by members of the Open Government Partnership's Legislative Openness Working Group, GLOW featured more than 20 events and activities organized by parliaments and civil society organizations in over 15 countries around the world. This year included a diverse range of activities, such as public events and private meetings, campaigns and advocacy, and hackathons and the development of new digital tools. The diversity of approaches and actors that made Global Legislative Openness Week a success also demonstrates that the global movement for open, responsive legislatures is broad, deep, and growing.

Click here to read more.

How much is decided in Brussels? Open parliamentary data provides an answer!

Posted November 2, 2015 at 12:02pm by kamilopblog

Last year, the British media debated an interesting question of how changes to national law are affected by decisions taken at the EU level after Viviane Reding, a former EU commissioner, put forward that it could be as much as 70%.

This struck me as very interesting so I decided to take a look at how much it could be in my country, Czech Republic. The lower chamber of the parliament keeps excellent track of which bills are tied to the EU. This information is available as open data. It is therefore relatively easy to retrieve and analyse bills in bulk to gain valuable insight into the legislative process.

European institutions do not directly dictate the law. In most cases, only an outline of required changes is approved at the European level and individual member states are more or less free to decide on details. I took a look at all bills proposed since 2004 when the country entered the EU.

It turns out that about 30% of all bills transpose the European legislation into the national law. These bills are introduced by the government (as opposed to MPs who can also introduce bills) and constitute about 50% of government legislative activity. This is more or less constant over time – even Eurosceptic government in 2006-2010 proposed these “eurobills” about as much as other governments.

Once introduced, the “eurobills” are much more likely to successfully complete the legislative process. A chart below shows shares of bills according to their status in various electoral terms. In the past terms (2002-2013), all bills that were “not approved” are considered rejected. In the current term, the “not approved” bills can still complete the legislative process.

Click here to read more.

Czech Parliament releases more open data

Posted July 28, 2015 at 5:31pm by kamilopblog

The Czech parliament has been measured as one of the most open parliaments in Eastern Europe (for example here and here) and among few that proactively publish raw data. Recently, the IT Department of the parliament released several new datasets.

They started publishing open data in 2014 with encouragement from the local parliamentary monitoring community and have expanded the scope of the data several times since then. The first datasets released cover plenary voting and information about MPs, especially their membership in various parliamentary bodies.

Later, data on individual bill proposals were released, including detailed information on how they move through the legislative process. This is important not only for parliamentary monitoring experts but also for political science and law researchers since it reveals various practices of law-making that are not explicitly outlined in the rules of procedure of the parliament.

Several types of data from the Senate, the upper chamber of the parliament, were added after that. Newly, the parliament released detailed data on sessions and their agenda which I have immediately used in my latest blogpost (it is in Czech but Google translates it fairly well).

It is important to note that most of the data covers the entire period of post-communist history and in some cases even the interwar period of 1920s and 1930s, making the Czech Republic one of few countries where pre-WWII parliamentary data has been digitalized (along with the US, UK, Australia and France).

The data are released as regularly updated tables in the UNL format. We at KohoVolit.eu, a Czech and Slovak parliamentary monitoring organization, prefer this rather than publishing JSON or XML files via an API (application programming interface) since it makes it easier to access the data for people with no coding skills. The tables can be opened in Excel, which is used often for basic data analysis, as well as easily combined to reconstruct the original database.

APIs are much more useful for advance analyses and building applications on the data, but require a bit more experience to work with, which most users such as journalists and researchers do not always have. In the case of the Czech parliament, as well as several other Eastern European parliaments, KohoVolit.eu actually built an API in our ParlData.eu project.

In international comparison, the Czech parliament still remains among very few legislatures that proactively publish raw data. The most progressive country in this respect remains to be Sweden which provides an official API, as well as database dumps in most commonly used formats (CSV, JSON, SQL and XML).

Other countries with parliamentary APIs include Norway (plus dumps in CSV and XML formats), Switzerland (CSV, JSON, XML), Hungary where the parliament introduced its API fairly recently (though it requires registration) and Georgia where the official parliamentary API was actually built by a local parliamentary monitoring organization (JumpStart Georgia). Several other parliaments publish XML files with various types of data (e.g. in Ireland, Romania, Spain).

Kamil Gregor is a data analyst with KohoVolit.eu and Masaryk University in Brno, Czech Republic.
It’s pretty and it moves! Or, how to visualize parliamentary votes (Part 2)

Posted May 14, 2015 at 8:01am by kamilopblog

In the previous blogpost in this two-part series about visualizing parliamentary votes, I wrote about how various parliaments and parliamentary monitoring websites go about showing results of vote events in national parliaments. In this instalment, I will introduce a set of tools developed by KohoVolit.eu, a Czech and Slovak parliamentary monitoring organization to do this simply, effectively and attractively.

Our visualization of a single vote event is simple enough:

It’s a hemicycle where legislators are represented by small figures and their voting options are displayed either using a small symbol (in this case an asterisk) or using a background colour of the hemicycle. The visualization is of course interactive and you can get it either via GitHub or an online generator.

What if we want to show how legislators voted on multiple occasions or even on all the vote events during a parliamentary term simultaneously? This is possible using the principal component analysis (specifically, a model developed by Michal Škop). This statistical method returns a scatterplot where every legislator is represented by one point:

Click here to read more.

It’s pretty and it moves! Or, how to visualize parliamentary votes (Part 1)

Posted May 13, 2015 at 8:01am by kamilopblog

Many parliamentary monitoring organizations are in business of visualizing parliamentary votes – either because they collect voting data themselves or because they want to show how legislators decide in more informative and appealing ways than a simple list of legislators and votes they cast.

In this two-part blogpost, I want look at how this can be done as effectively as possible. The first part will review existing solutions employed by national parliaments and parliamentary watchdogs over the globe and the second part will showcase a solution that we have recently developed in KohoVolit.eu, a Czech and Slovak parliamentary monitoring organization.

Parliaments themselves are pretty much terrible when it comes to visualizing voting results. Not only that, a recent global survey shows that they often fail at recording or publishing parliamentary votes in the first place – out of some 280 parliamentary chambers of sovereign nation states, only about 70 of them publish voting results by names of individual legislators.

The parliaments that do publish voting results almost always limit themselves to showing only a list of legislators’ names and votes. In many cases, their party membership is not included which seriously limits re-usability of this information, especially if legislators often switch their parties and/or when webpages or PDF files with voting results do not link to additional details about individual legislators.

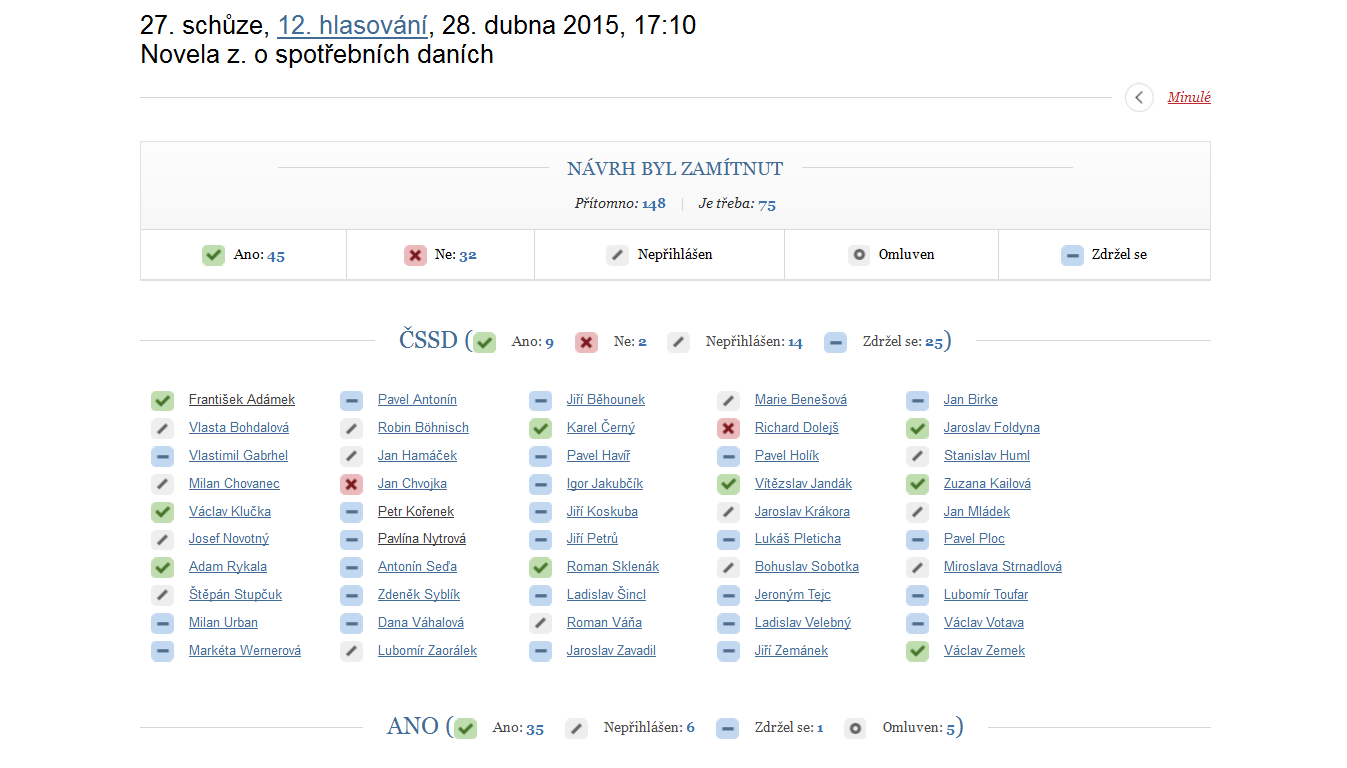
There are parliamentary chambers that include at least some graphical features that help users quickly discern how individuals and parties voted, e.g. the Chamber of Deputies of the Czech Parliament:

image

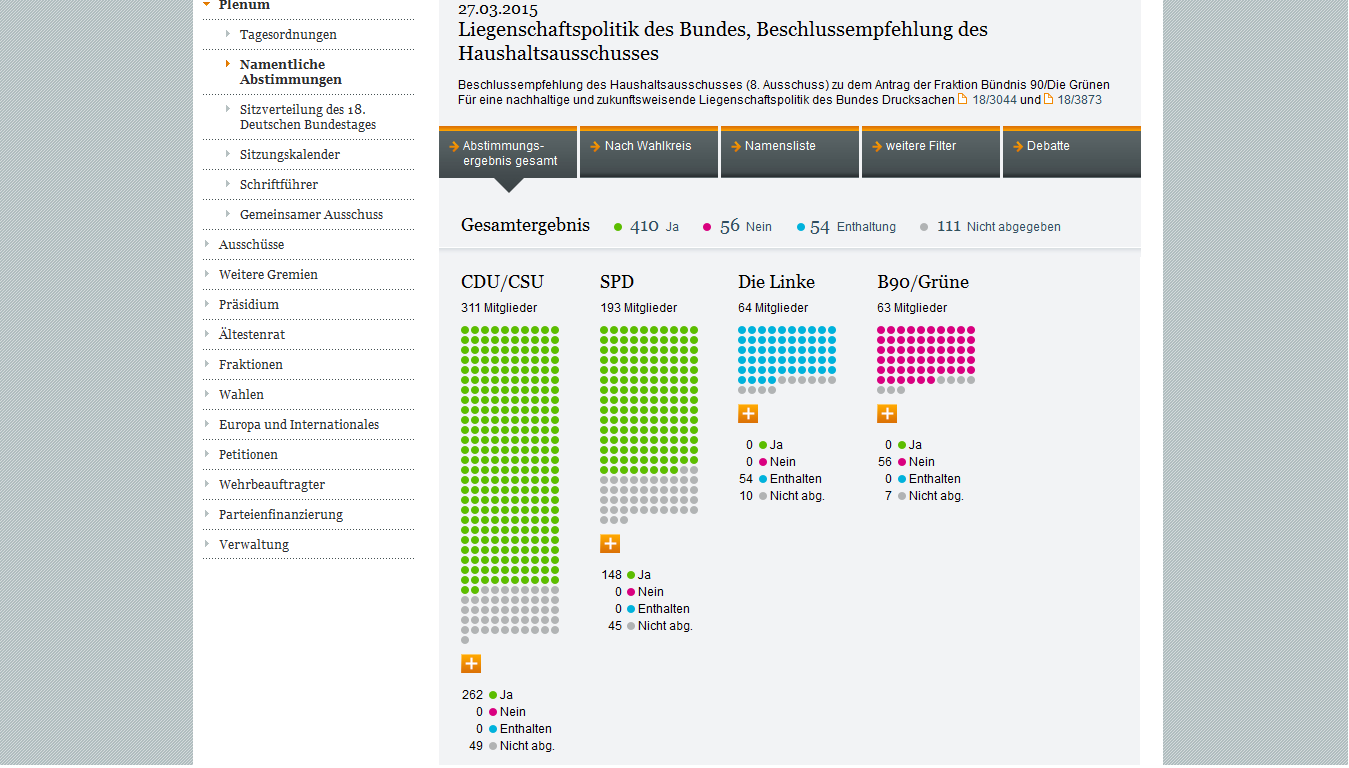
There are parliaments that attempt to go beyond listing legislators and their votes and use charts and other graphical features to show various characteristics of the vote. For example, the German Bundestag uses coloured circles to represent quantities of legislators.

image

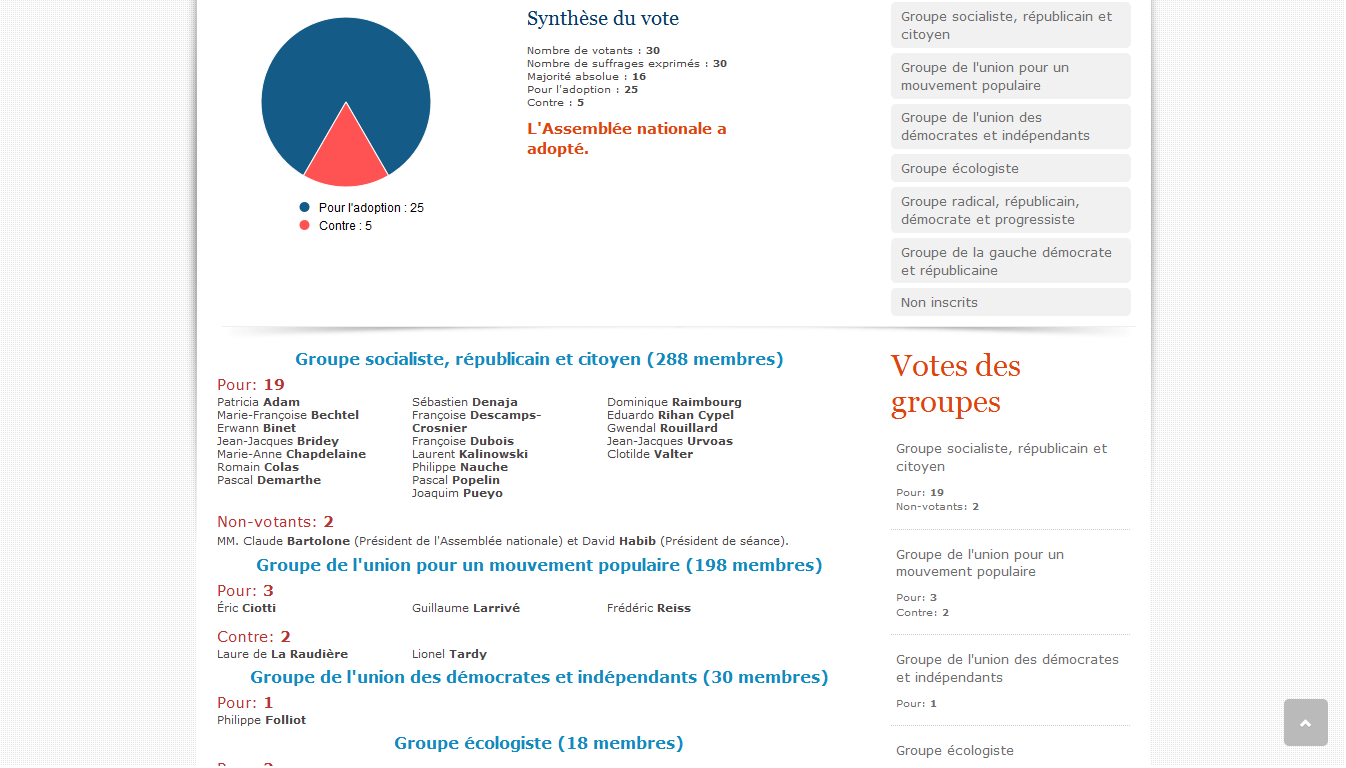
Other parliamentary chambers, such as the National Assembly of the French Parliament, employ bar or pie charts to show relative quantities of legislators that select various voting options:

image

Other examples of this solution include the Danish Folketing, the Russian Duma, the Spanish Chamber of Deputies, the Mexican Senate or the Lower House of the Parliament of Ireland.

It is obvious from these examples that visualizing results of one vote event is not as simple as it may seem. There are actually several types of information involved and one would ideally want to find a solution that simply and effectively displays all of them.

Click here to read more.

New application for tracking parliamentary votes: pretty and easy to set up

Posted April 8, 2015 at 12:02pm by kamilopblog

KohoVolit.eu, a Czech and Slovak parliamentary monitoring organization, has developed a new application that allows users to store, visualize, and analyse parliamentary votes. The idea came when we were approached by the Green Circle, an environmental organization that has been tracking parliamentary voting related to environmental protection in the Czech Parliament since 1993 and producing regular reports on how eco-friendly individual MPs vote. Over the course of the years, their expertise generated a unique substantive insight into political preferences of MPs but it largely remained stuck in overcomplicated Excel sheets or even on paper. They asked us to design a portal to open up this information.

The collaboration resulted in so called “Parliamentary Tree-Frog” (Parlamentní rosnička) – a first instance of the new application. In European folklore, the tree-frog (Hyla arborea) is associated with predicting the weather and is also among animal species that are the most endangered by damaging the environment, hence the name of the portal. When developing the application, we were inspired and used some of the open code of the Scoring the European Parliament project.

The application is essentially a tool for visualizing results of so called interest group ratings. Such ratings are created by interest groups (e.g. political watchdogs, trade unions, employers’ associations) that select important parliamentary votes in a narrowly defined policy area (e.g. environmental protection, human rights, taxation, various social issues), determine how MPs should have voted in order to promote a desired outcome (in this case environmental protection) and then rank MPs based on how closely their actual voting behaviour matched this optimal voting record. These ratings are still relatively rare in Europe but there have been dozens of them in the U.S., some of them active since 1970s. Most of the major U.S. interest group ratings are aggregated on the Vote Smart project website.

The application calculates a rating – based on some 250 eco-friendly votes to date – simply as a percentage of all instances when an MP voted in line with environmental protection out of all votes when he or she was present in the Parliament. Differences in values of the rating among parties and changes over time are visualized on the main page where users can also select specific parties, terms or votes and perform search queries:

Click here to read more.

Using open legislative data to map bill co-sponsorship networks in 15 countries

Posted March 16, 2015 at 2:52pm by francoisopblog

A few years back, Kamil Gregor published a post under the title “Visualizing politics: Network analysis of bill sponsors”. His post, which focused on the lower chamber of the Czech Parliament, showed how basic social network analysis can support the exploration of parliamentary work, by revealing the ties that members of parliament create between each other through the co-sponsorship of private bills.

As Kamil observed, this kind of research is heavily dependent on open legislative data, which does not exist for many parliaments. There has been, however, some amount of progress in that area – and even when parliaments do not develop open data portals, they often maintain quite detailed official websites.

In what follows, I would like to quickly report on a small research project that I have developed over the years, under the name “parlnet”.

Legislative data on bill co-sponsorship

This project looks at bill co-sponsorship networks in European countries. Many parliaments allow their members to co-sponsor each other’s private bills, which makes it possible to represent these parliaments as collaborative networks, where a tie exists between two MPs if they have co-sponsored legislation together.

This idea is not new: it was pioneered by James Fowler in the United States, and has been the subject of extensive research in American politics, both on the U.S. Congress and on state legislatures. Similar research also exists on the bill co-sponsorship networks of parliaments in Argentina, Chile andRomania.

Inspired by this research and by Baptiste Coulmont’s visualisation of the French lower chamber, I surveyed the parliamentary websites of the following countries:

  • all 28 current members of the European Union ;
  • 4 members of the EFTA: Iceland, Liechtenstein, Norway, and Switzerland

This search returned 19 parliamentary chambers from 15 countries for which it was (relatively) easy to extract legislative data, either through open data portals like data.riksdagen.se in Sweden ordata.stortinget.no in Norway, or from official parliamentary websites directly.

From legislative data to network graph

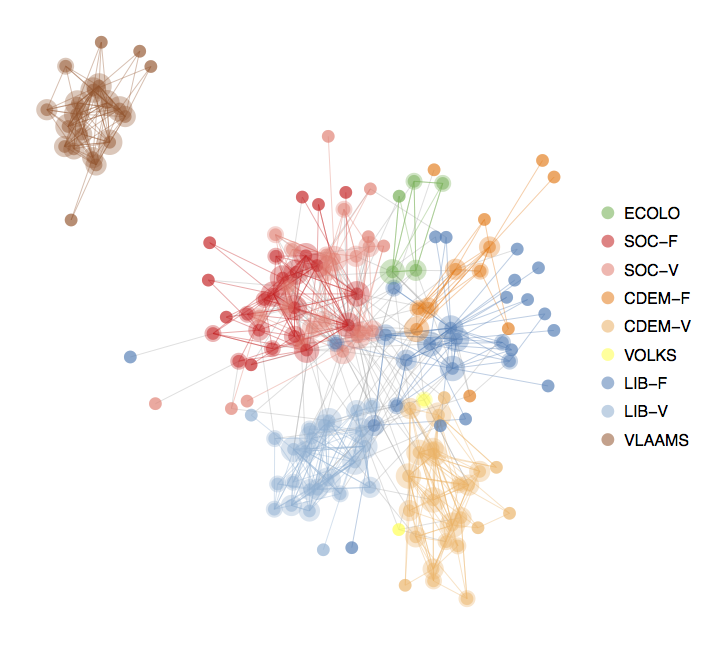
After splitting the data into legislative periods separated by nationwide elections, I was able to draw a large collection of networks showing bill co-sponsorship in these 19 chambers. Here, for instance, is the network for the Belgian lower chamber during its 51st legislature (years 2003-2007):

image

Click here to read more.